
Unlock Your Dashboard: Insights into Your Order Performance
The dashboard provides tailored insights for brokers and operators, helping you manage inquiries, track order performance, and access critical updates. Here's how to navigate and use its features effectively.
Shared Features for Both Brokers and Operators
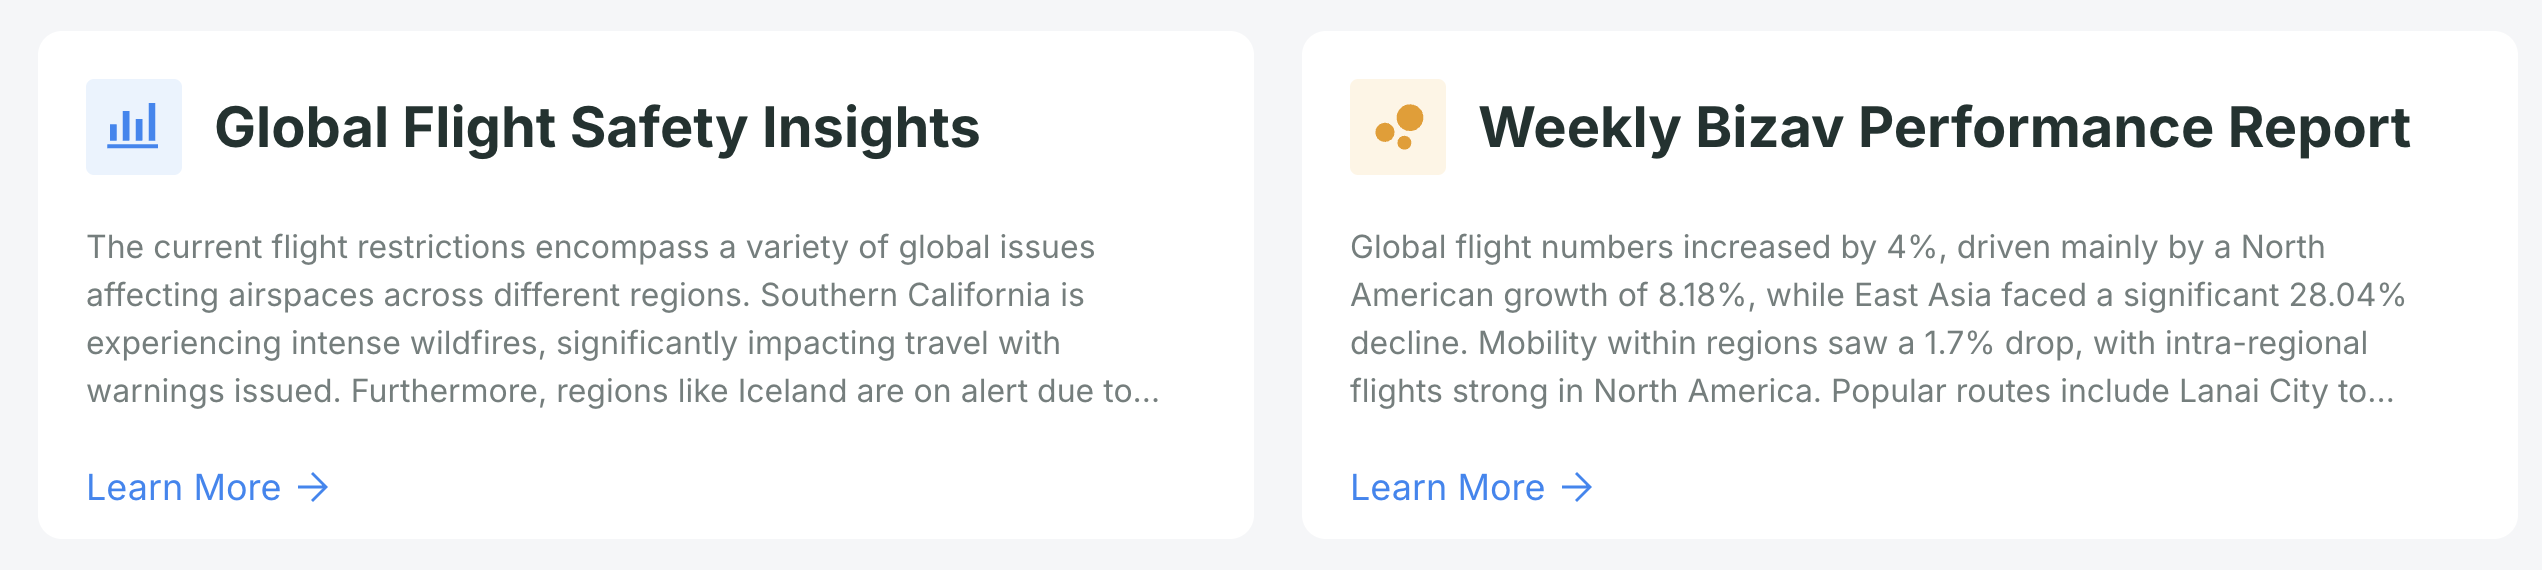
Global Flight Safety Insights (Daily Updates)
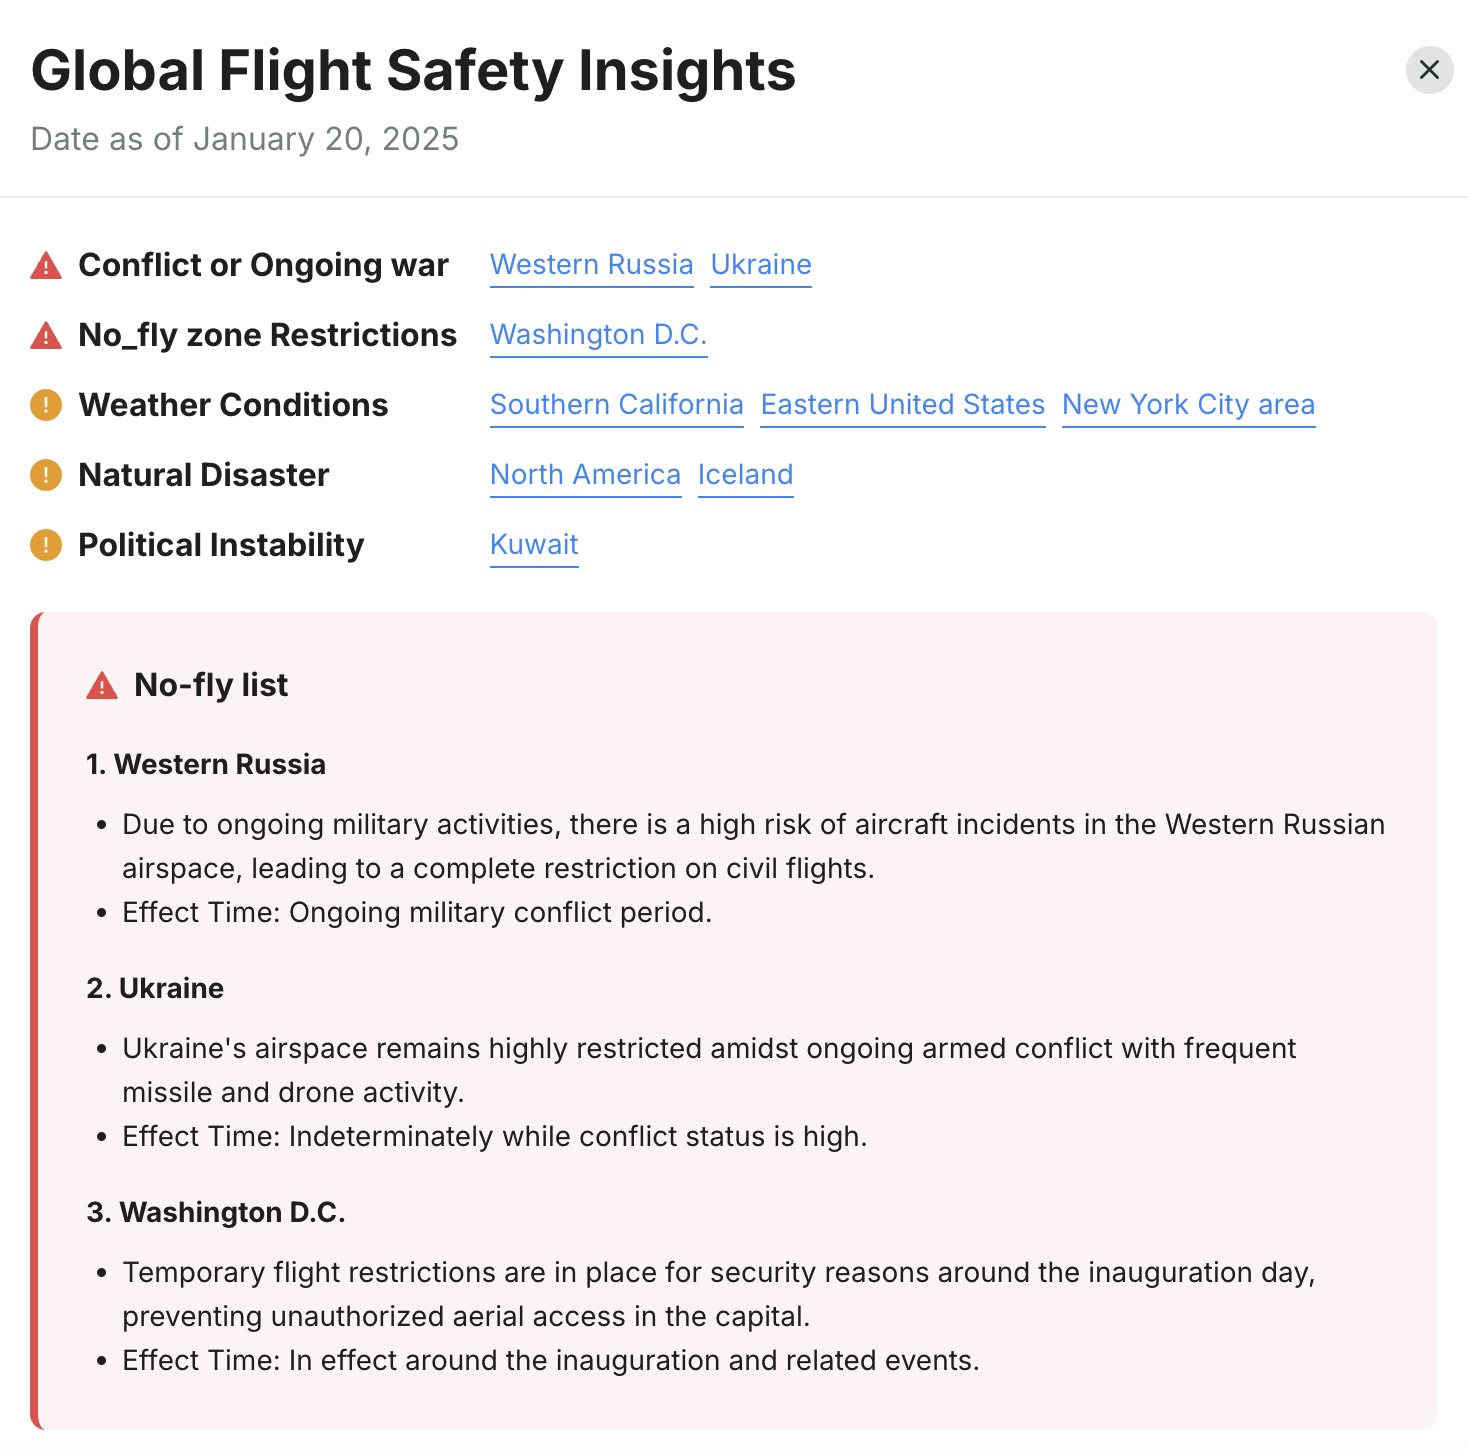
Stay informed with daily updates on global flight safety constraints. Use this section as a guide to proactively adjust your clients’ planned schedules. Key updates include:
- Conflicts or Ongoing Wars
- No-Fly Zone Restrictions
- Weather Conditions
- Natural Disasters
- Political Instability
These insights helps you anticipate and mitigate potential disruptions in flight plans.
Weekly Bizav Performance Report (Weekly Updates)
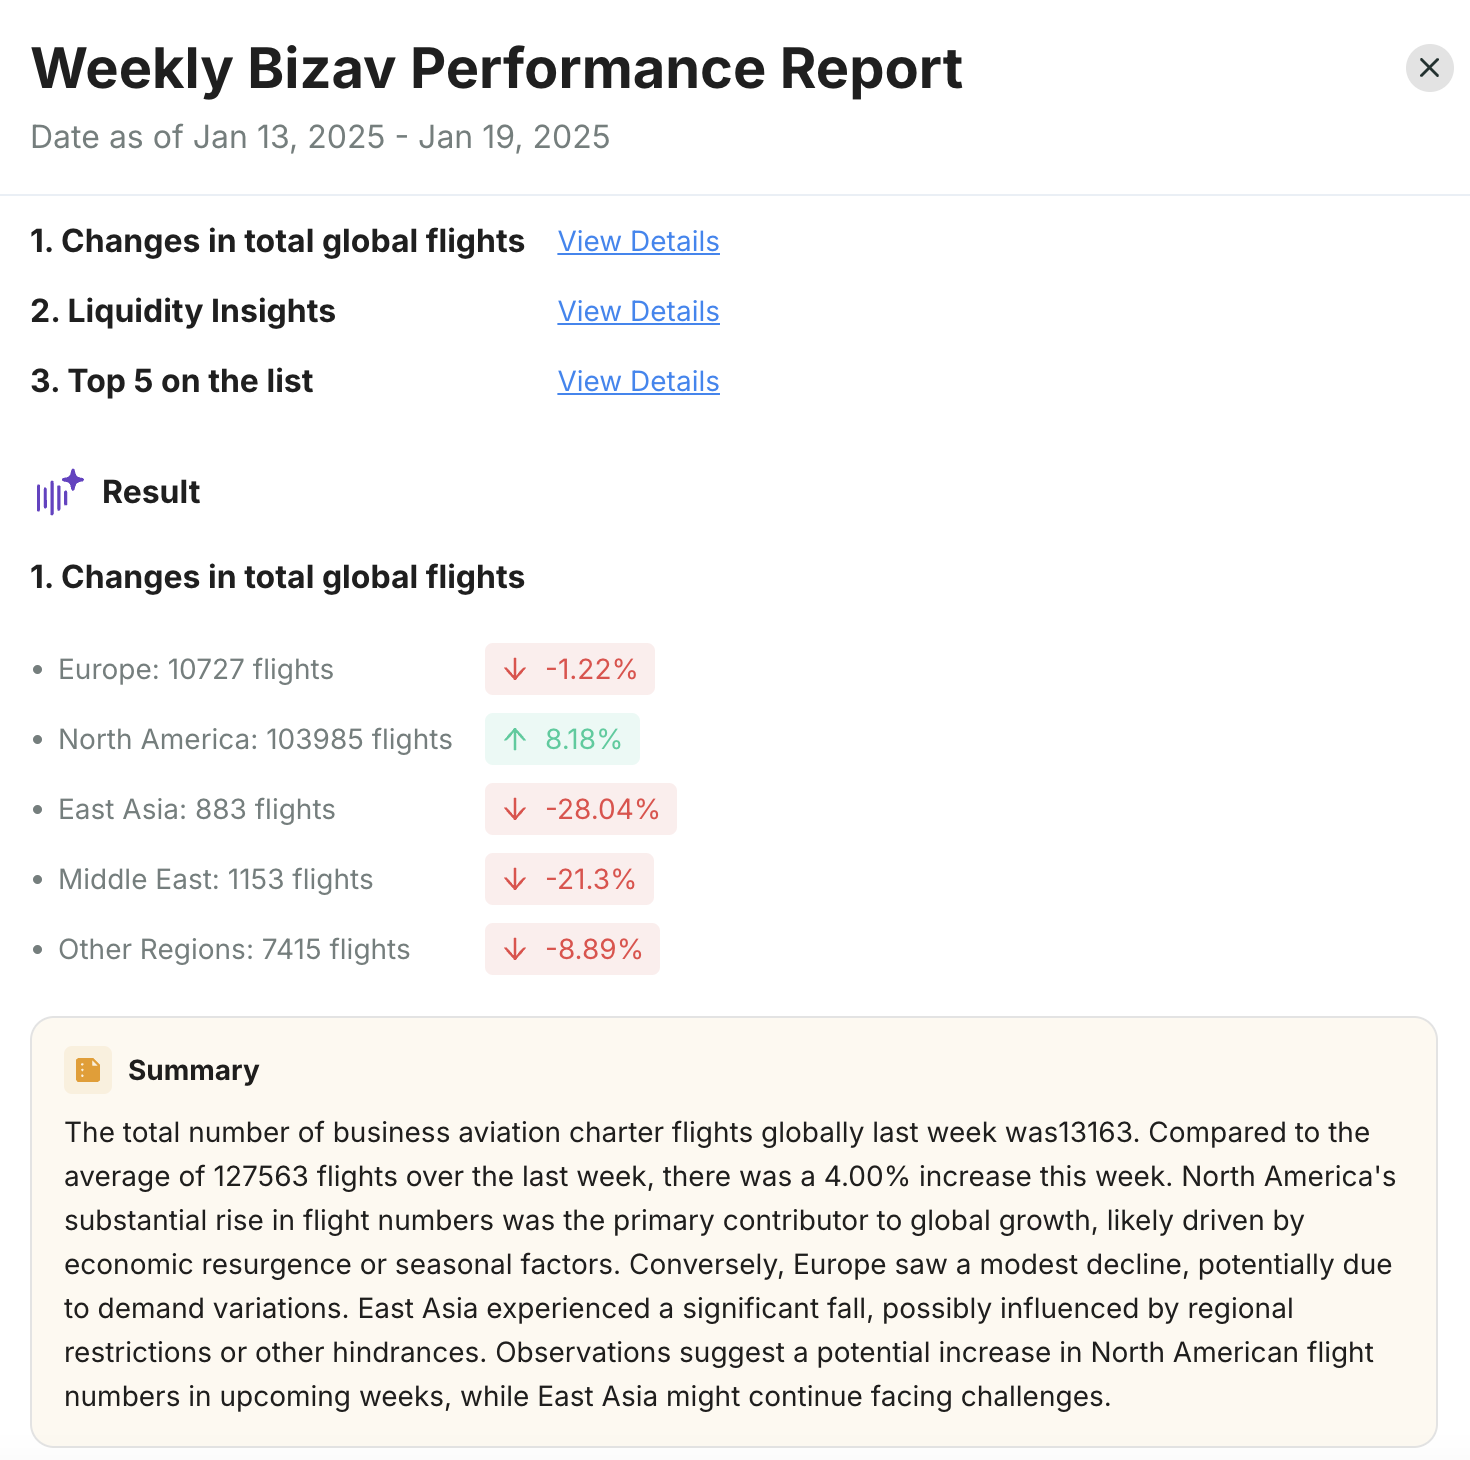
Stay on top of business aviation performance with weekly insights. Updated on a weekly basis, you’ll receive the performance report from the previous week. These insights are designed to keep both brokers and operators aware of broader market trends. Key metrics include:
- Changes in Total Global Flights
- Liquidity Insights
- Top 5 on the List
These updates offer valuable insights into global flight activity, market trends, and performance.
Dashboard for Brokers
Overview of Your Inquiries
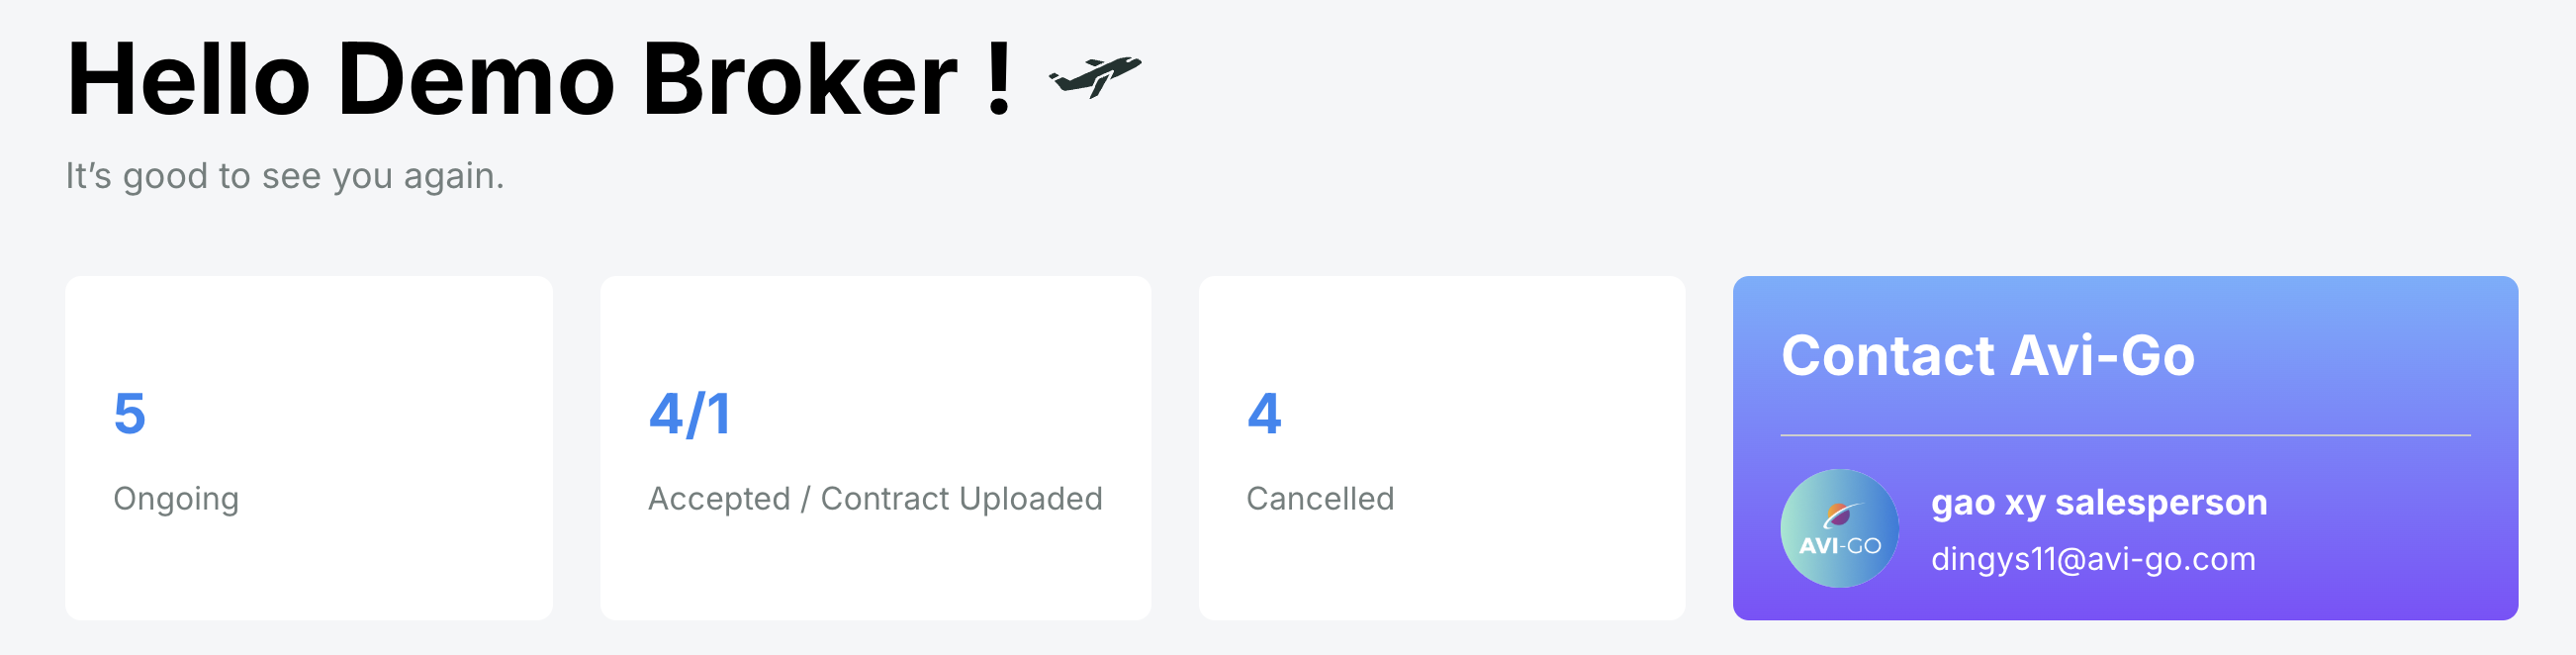
View a summary of all sales inquiries, including a breakdown by order status (e.g., ongoing, accepted, cancelled). Click on any status block to navigate directly to the order page and manage the details.
Flight Distribution (by Departure Region)
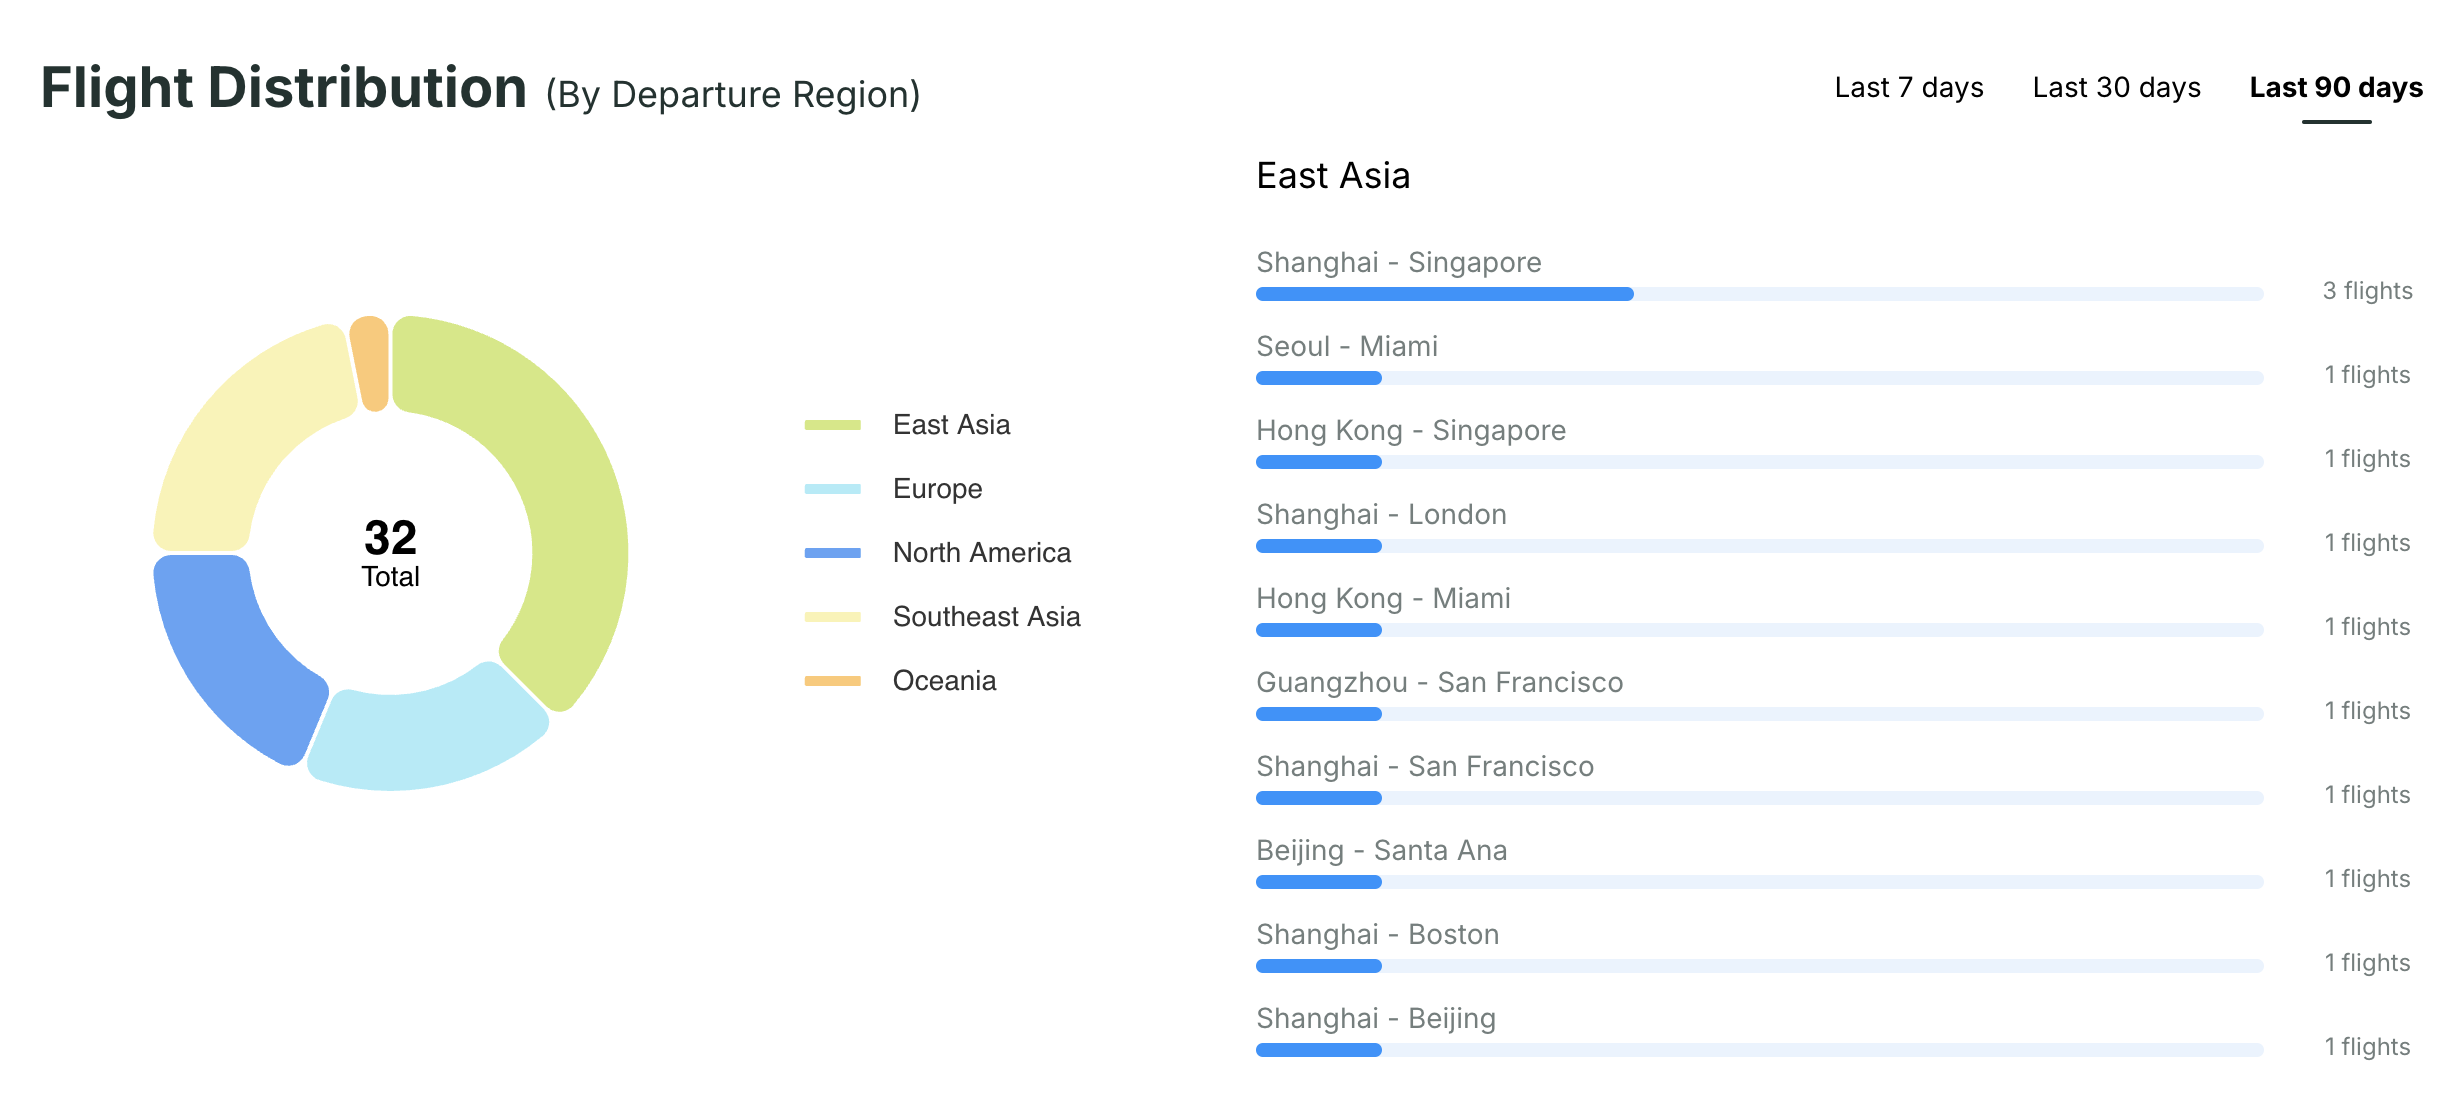
Analyze the performance of your inquiries by departure region through visualized charts. This feature allows you to:
- See the proportion of inquiries from different regions (e.g., Europe, North America, East Asia) displayed.
- Click on any region to view a detailed performance breakdown by specific departure and arrival cities within that region.
- Use filters to quickly switch between the last 7, 30, or 90 days to see how your data trends over time.
Operator Deal Rankings
Track operator performance based on how they respond to your inquiries and how frequently they settle deals with you.
- By Response Rate :
- See the top 10 operators with the highest response rates to your inquiries.
- A stacked bar chart shows how many inquiries you’ve sent to each operator, along with their responses (unanswered, quoted, rejected).
- Hover over the bars to get detailed insights into each operator’s response rate and engagement .
- By Transaction Frequency :
- View the top 10 operators who’ve closed the most deals with you.
- Quickly assess your most reliable operators based on the number of completed transactions, helping you identify the ones you work with most frequently.
Dashboard for Operators
As an operator, you have a general overview to manage your quotations and inquiries. You can easily switch between the Quotation tab and the Inquiry tab to stay on top of the latest information and trends.
For brokers who have fleets uploaded to the marketplace, there will be Quotation tab available for you.
Overview of Your Quotations
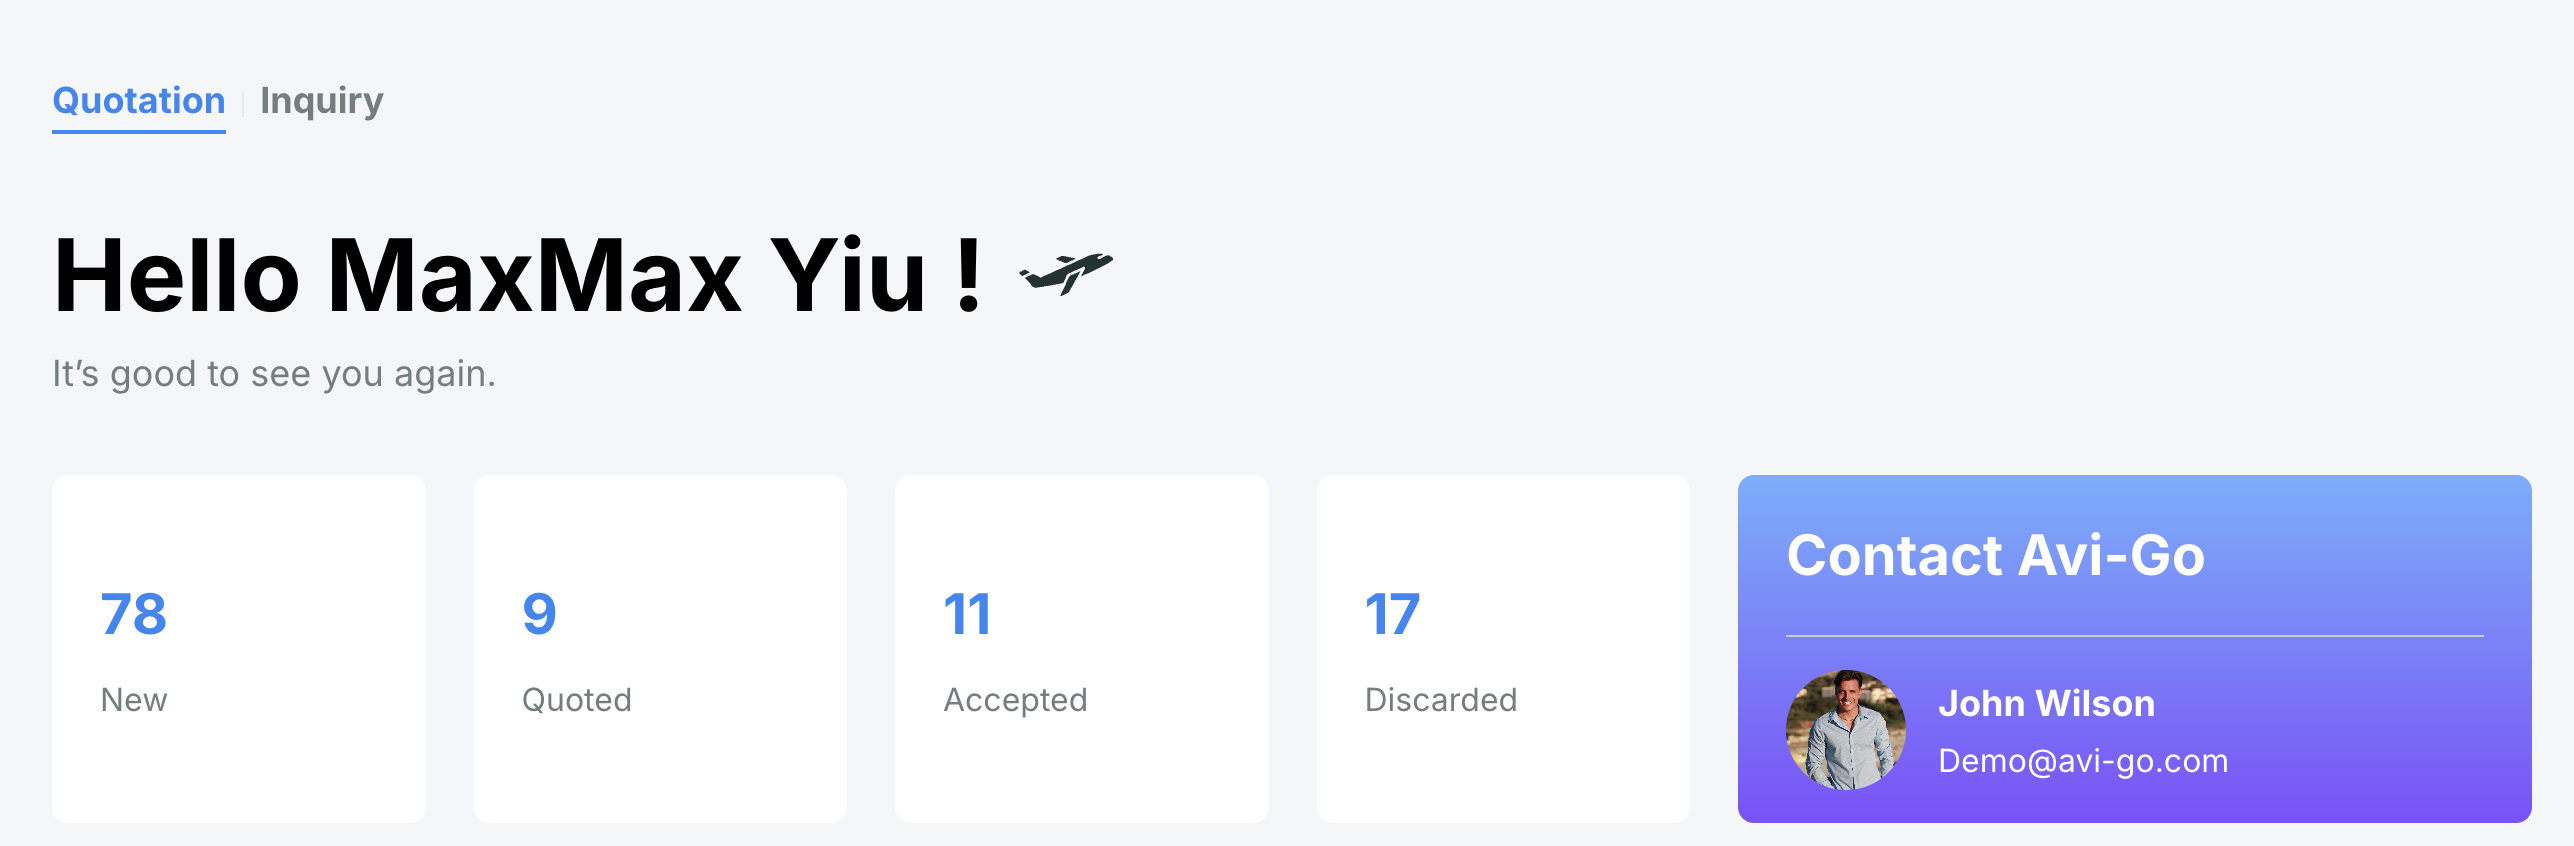
Get a snapshot of all your quotations, organized by order status (e.g., new, quoted, accepted, discarded). Quickly access the details by clicking on any status block to jump straight to the order page for easy management and updates. Understand the flow of your quotations and where they stand in the pipeline at a glance, giving you a clear overview of your performance.
Flight Distribution (by Departure Region)
Understand the areas brokers are most interested in when they inquire about your aircraft.
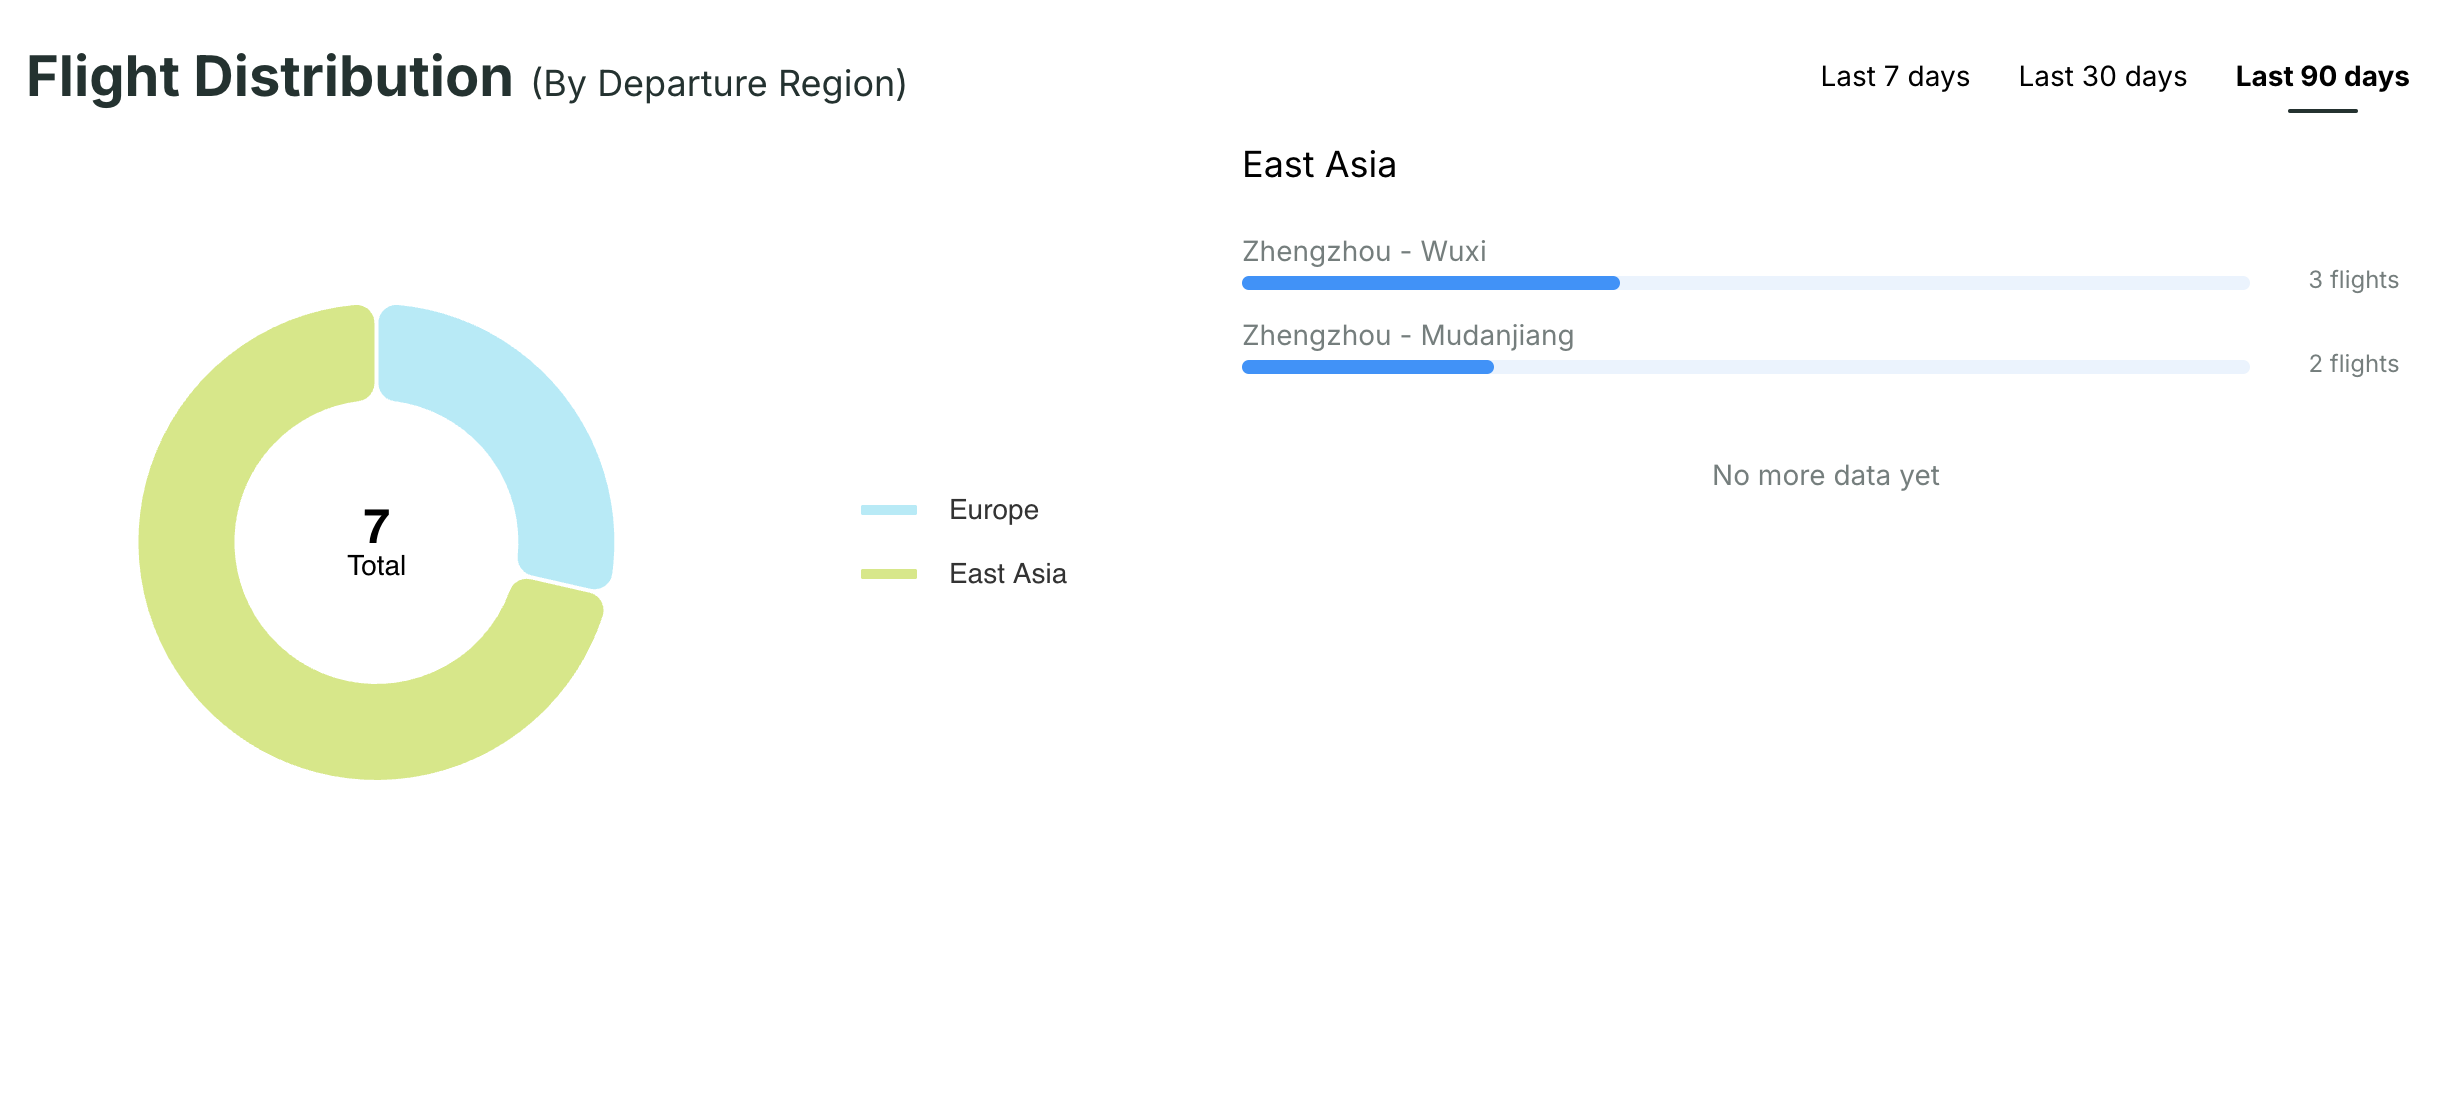
- View a distribution of the inquiries you’ve received, helping you identify which regions or markets brokers are inquiring about. This gives you a clear picture of your reputation and what areas brokers associate your fleet with.
- Click on any region to view a detailed performance breakdown by specific departure and arrival cities within that region.
- Use filters to quickly switch between the last 7, 30, or 90 days to see how your data trends over time.
Broker Deal Rankings
Analyze your interactions with brokers based on request quantity and transaction frequency. This section is divided into two key parts:
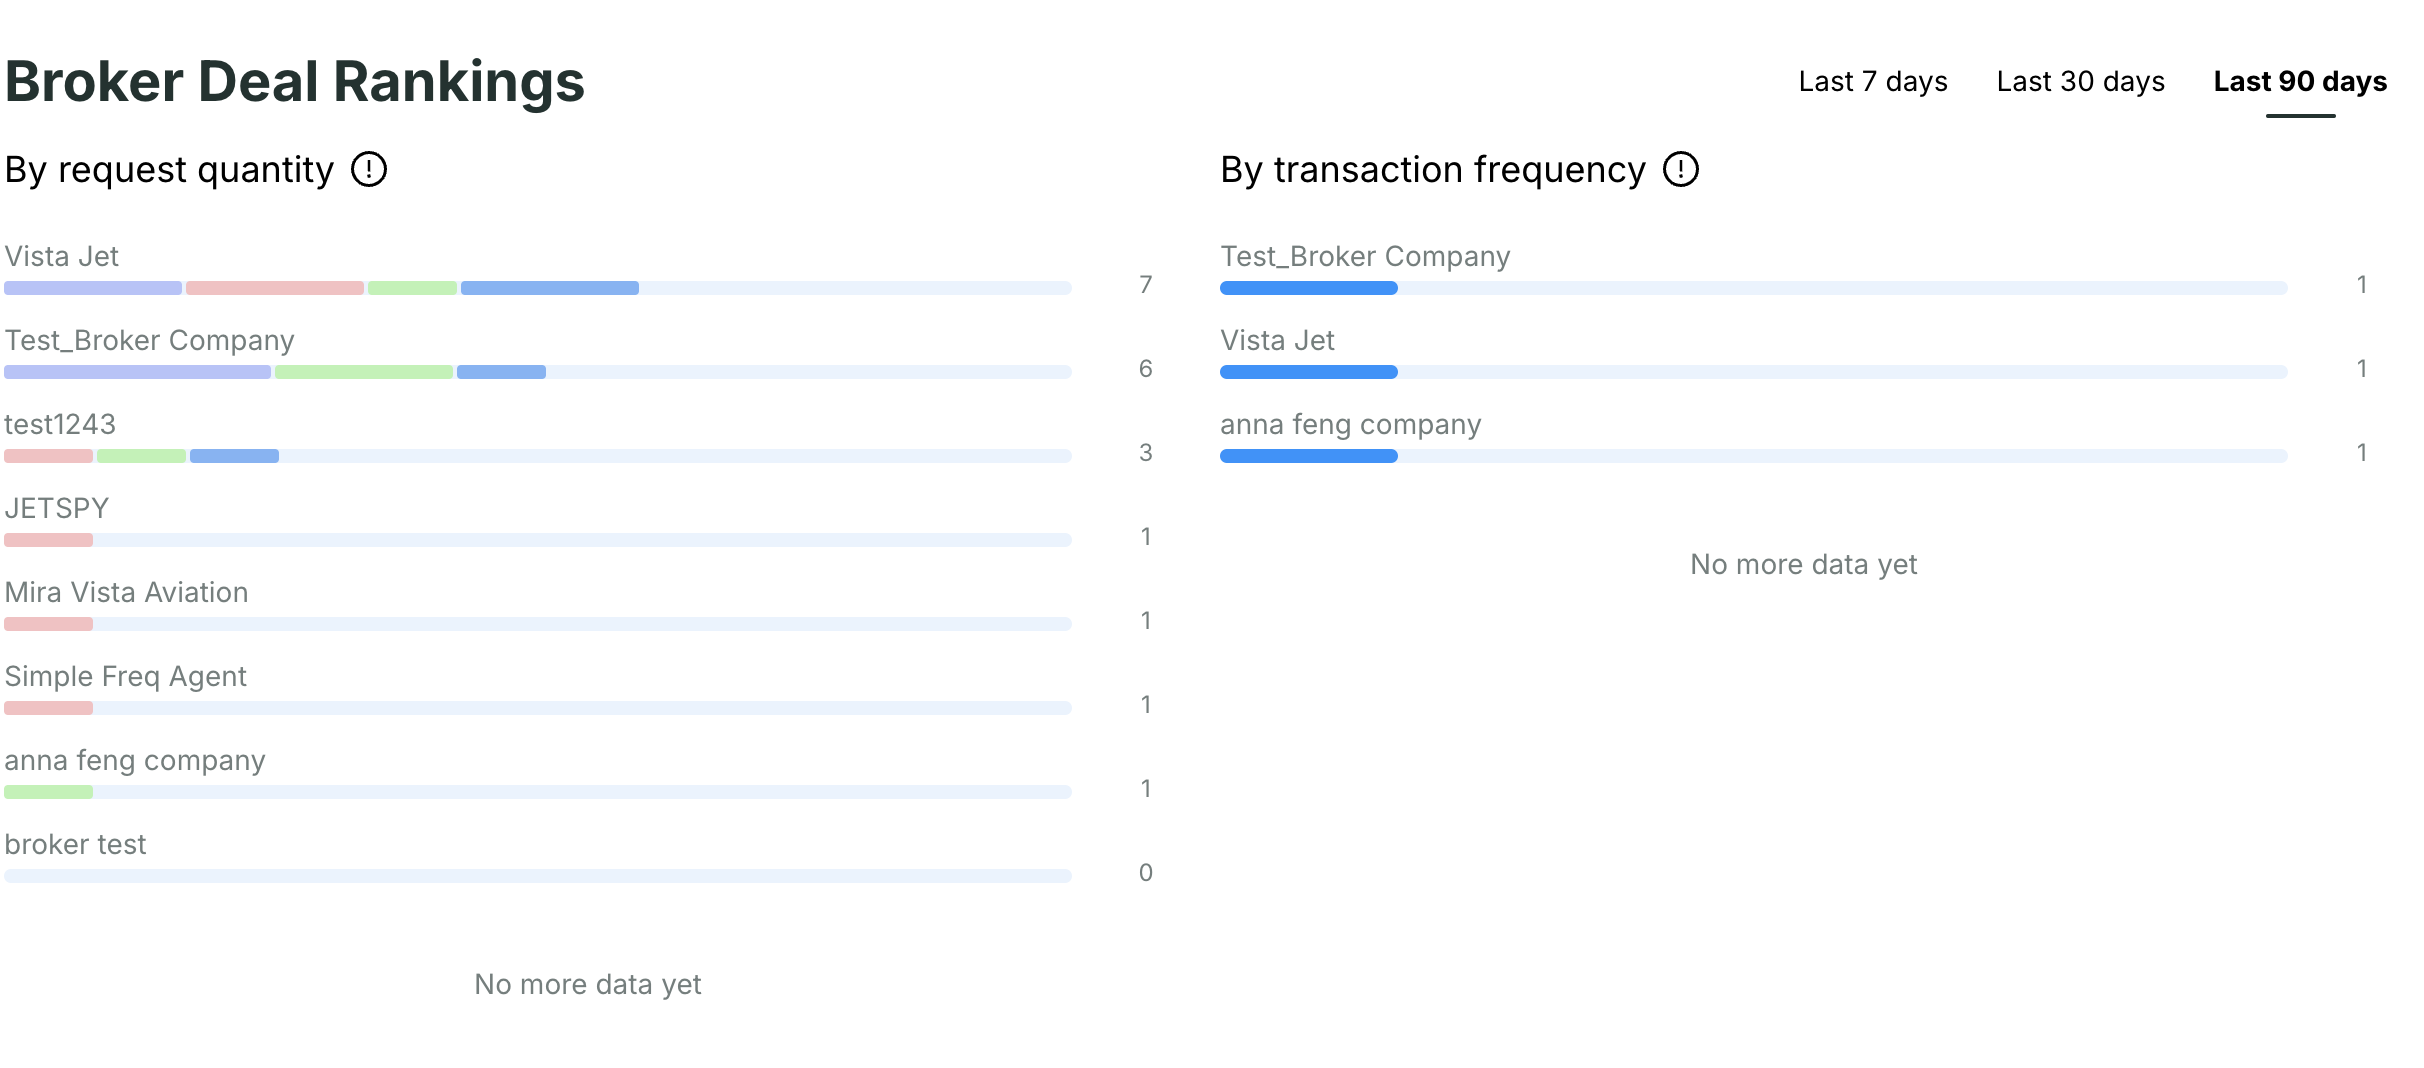
- By Request Quantity
- See the top 10 brokers who have sent you the most inquiries.
- A stacked bar chart displays inquiry details (total requests, new, quoted, accepted, discarded).
- Hover over any bar to see detailed stats for each broker’s inquiries.
- By Transaction Frequency
- View the top 10 brokers who’ve settled the most deals with you.
- Get insights into your most frequent and active broker partnerships, helping you prioritize ongoing relationships.
Subscribe to the Avi-Go Newsletter
Business aviation data, insights, and trends — trusted by 10,000+ professionals worldwide.