Phoenix Deer Valley Tops US General Aviation Airports With 490,702 Movements in 2025
Why It MattersGrowth at a reliever field outpacing its commercial neighbour shows general aviation traffic concentrating at dedicated airports, where operators and local capacity decide ranking rather than airline schedules.
What happened
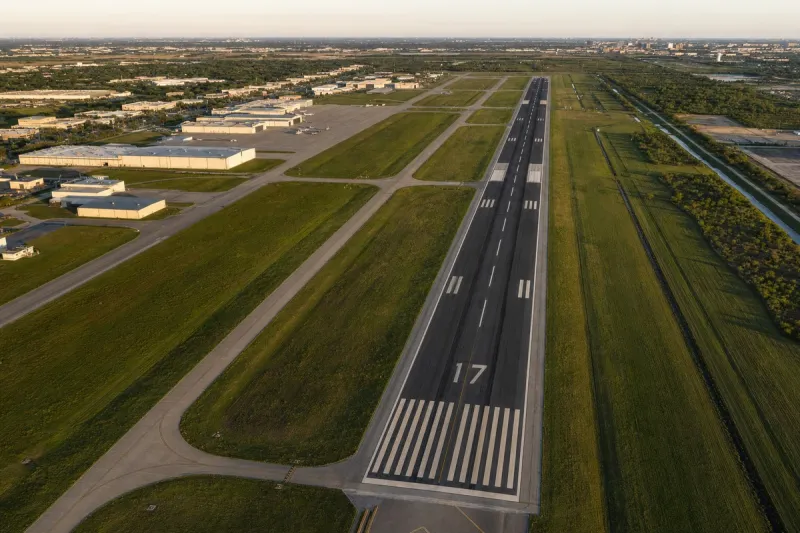
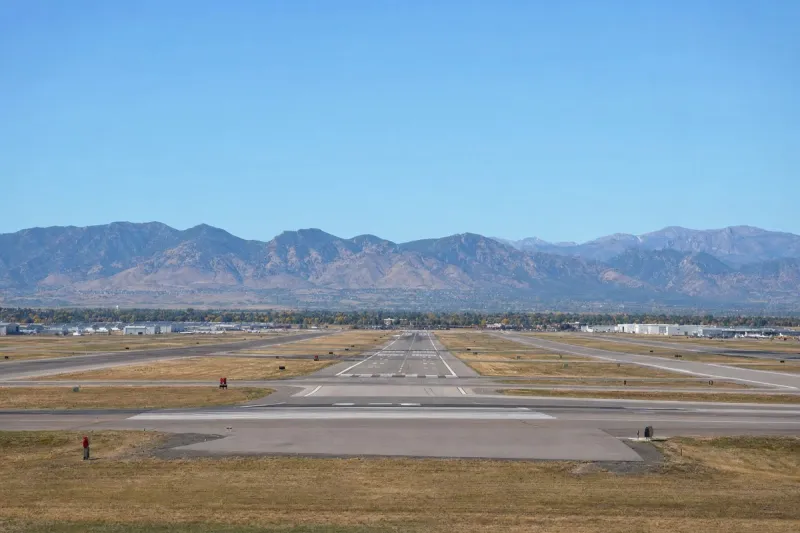
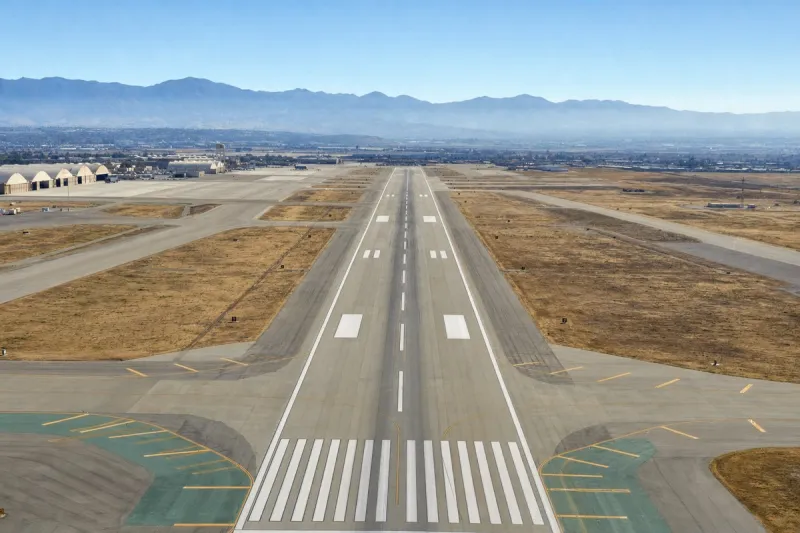
Phoenix Deer Valley Airport (DVT) is the busiest general aviation airport in the US, with 490,702 aircraft movements in 2025, according to AirAdvisor's analysis of 2025 ACI data. That is up 13.4% from 2024, the largest increase among the national top 10 airports by movements.
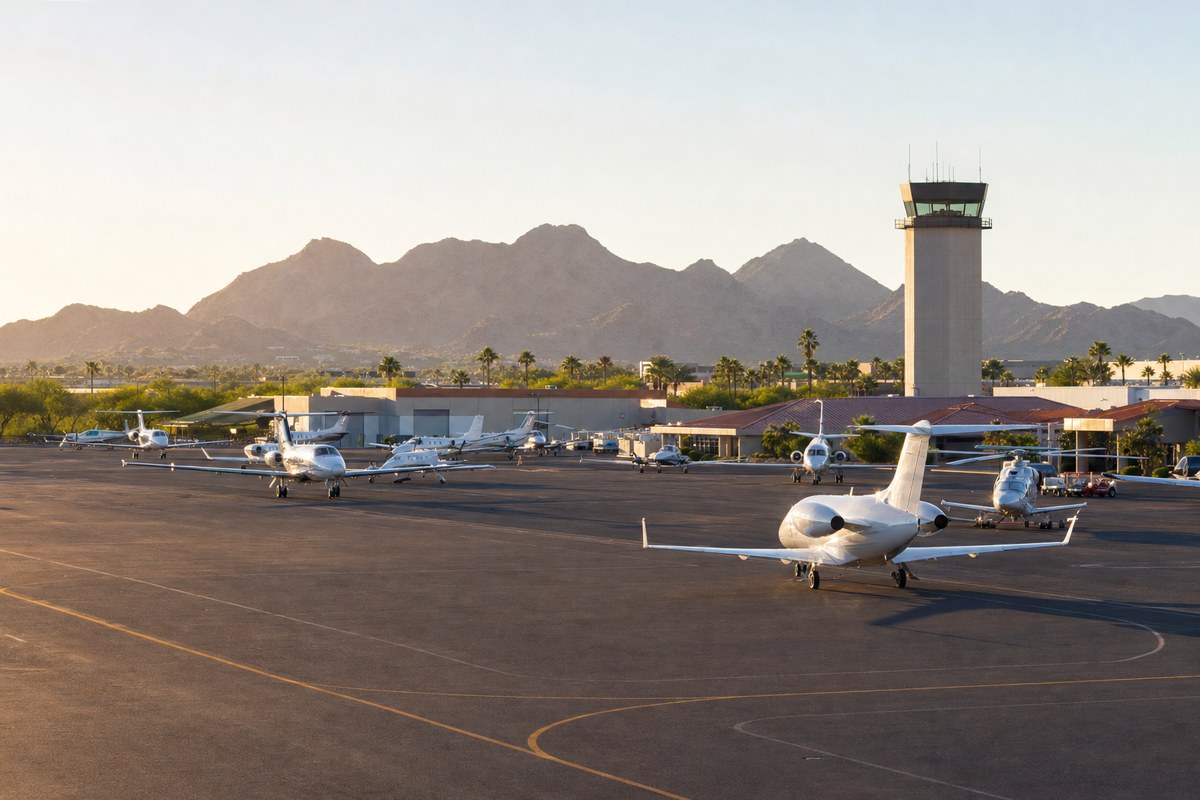
The total makes DVT the ninth-busiest US airport by movements, just ahead of Phoenix Sky Harbor, which logged 487,142. Phoenix Sky Harbor's media kit says DVT ranked 13th in the world and was the busiest general aviation airport in North America. The airport lies about 17 miles (27 km) north of Sky Harbor.
The ranking counts operations, meaning individual takeoffs and landings, and combines 2025 ACI data analyzed by AirAdvisor, Pilot Institute's airport-by-airport ranking and FAA-based business aviation figures. Because those sources cover different years and use different methods, the figures are not directly comparable in every case.
Pilot Institute's operations counts for the airports behind DVT run as follows: Centennial Airport (APA) in second with 312,153; Montgomery-Gibbs Executive Airport (MYF) in San Diego in third with 272,813; and Prescott Regional Airport (PRC) in fourth with 256,931.
Industry impact & what to watch
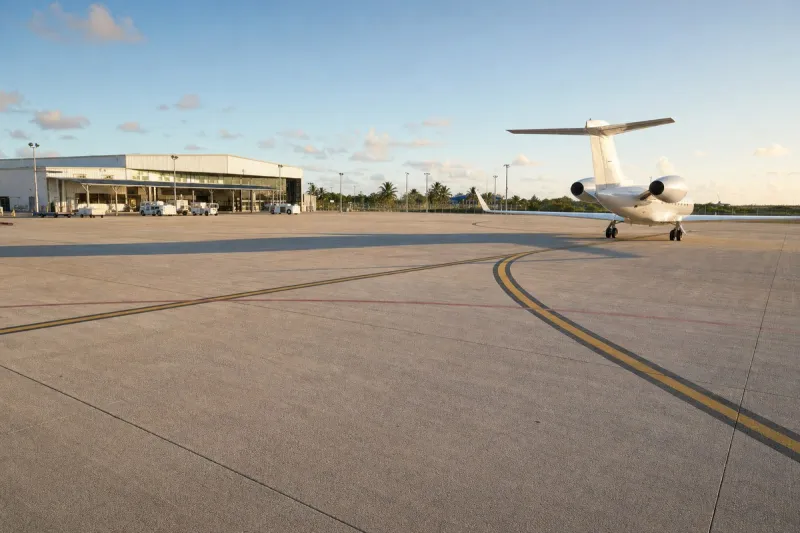
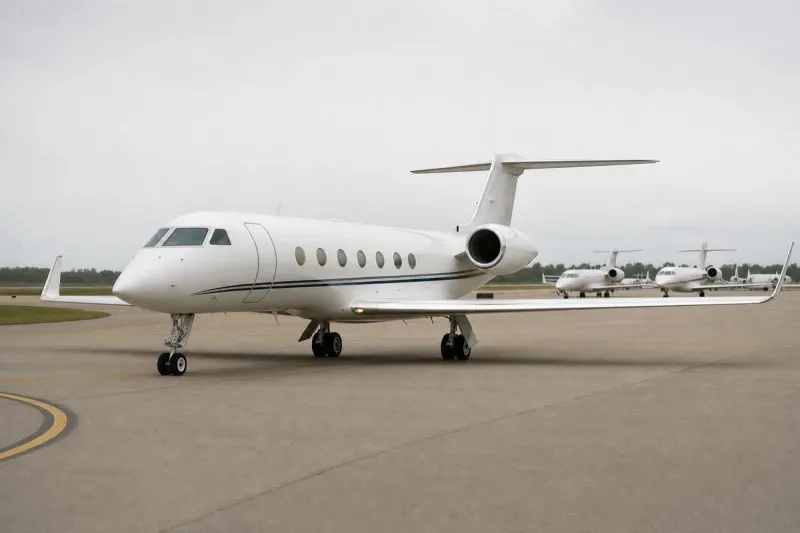
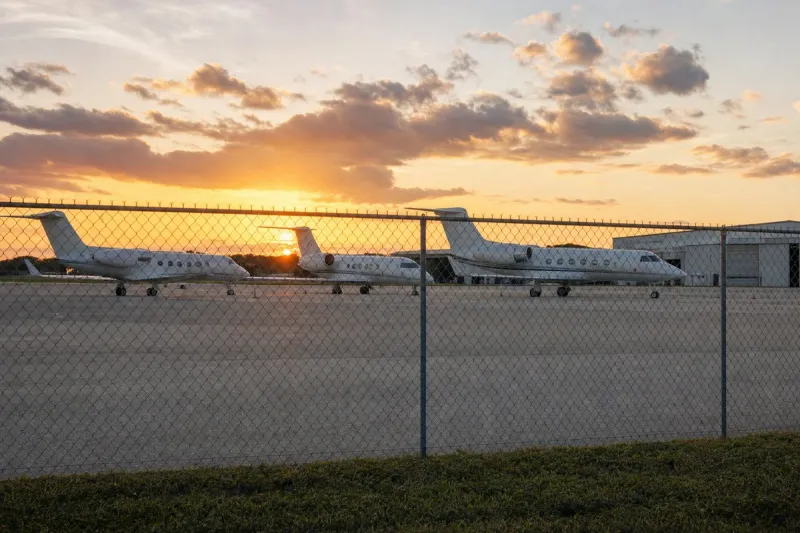
A general aviation field passing the commercial airport it serves is a sign of where light-aircraft and business-flying demand now sits. Operations counts reward airports with high volumes of training, private and corporate flights, and those flows depend on local capacity and operators rather than on airline schedules. DVT's lead over APA, 490,702 against 312,153 on Pilot Institute's count, is wide enough that the gap is unlikely to come from methodology alone, though the sources do mix years and methods.
For anyone benchmarking airports, the mixed provenance matters more than the headline. A comparison that sets ACI-based 2025 totals beside Pilot Institute's counts and FAA-derived business aviation figures needs the underlying year and counting method stated for each airport before it is used to size a market.
The next data to read is the following year's ACI release: it will show whether the 13.4% jump at DVT was a one-year step or the start of a sustained climb, and whether Sky Harbor's 487,142 holds as the line DVT stays above.