UAE-Origin Premium Seats to Southwest Pacific Rose 13.2% a Year in 2023-2025, but Dubai-Auckland Added None
Why It MattersFlat scheduled premium seats on a corridor do not prove flat demand when high-value travel moves by private aviation, so range, margin and conflict-driven schedule gaps shape what capacity can serve.
What happened
Between 2023 and 2025, UAE-origin First and Business class seats to the Southwest Pacific rose from 282,152 to 361,594, a 13.2% compound annual growth rate. That was second only to Northeast Asia (15.6%) among eight global regions, according to OAG scheduled-seat data cited in a Flight Plan analysis. Dubai-Auckland added no premium seats over the period.
OAG's 2026 forward schedule shows regional premium capacity at 270,286 seats, 25.3% below 2025. Only January to August 2026 reflects near-final schedules; September to December remains provisional. The Southwest Pacific accounts for 5.0% of total UAE outbound premium capacity.
Dubai-Sydney and Dubai-Melbourne carry 49% of the region's 2025 premium seats, and adding Dubai-Brisbane and Dubai-Perth lifts the share to 80%. Dubai-Sydney grew 10.8% a year and Dubai-Melbourne 10.0%. Dubai-Brisbane and Dubai-Perth, at 20.2% a year, are the region's fastest-growing corridors. Dubai-Auckland grew 0.0%. Abu Dhabi-Sydney grew 6.9%, Abu Dhabi-Melbourne declined 9.3%, and Dubai-Adelaide was new in 2025.
Part of the 2026 decline reflects the US-Iran conflict that began on 28 February 2026, which closed Gulf airspace and briefly halted Emirates' Dubai operations. By late April Emirates had recovered to about 80% of pre-war capacity and Etihad to about 75%. Tier 1 corridors are down about 20%, Brisbane is down 40.2% and Perth 47.3%, while Abu Dhabi-Sydney is the only growing corridor (+16.8%).
Distances and aircraft range
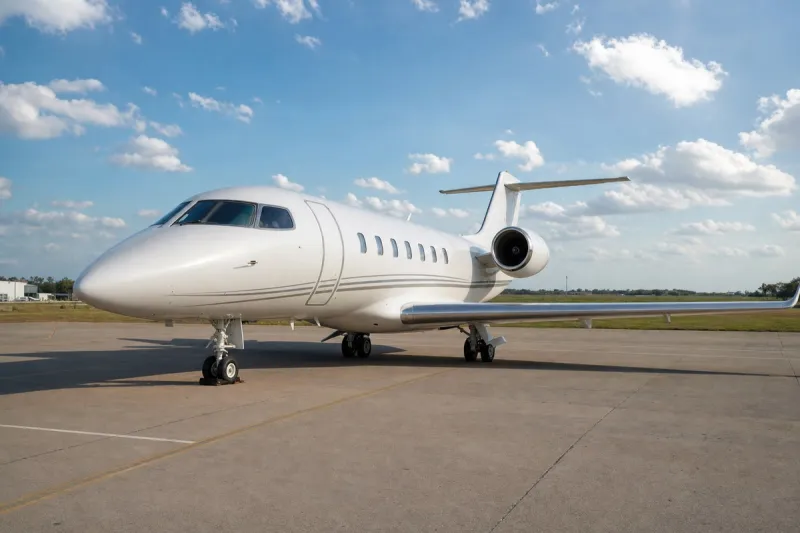
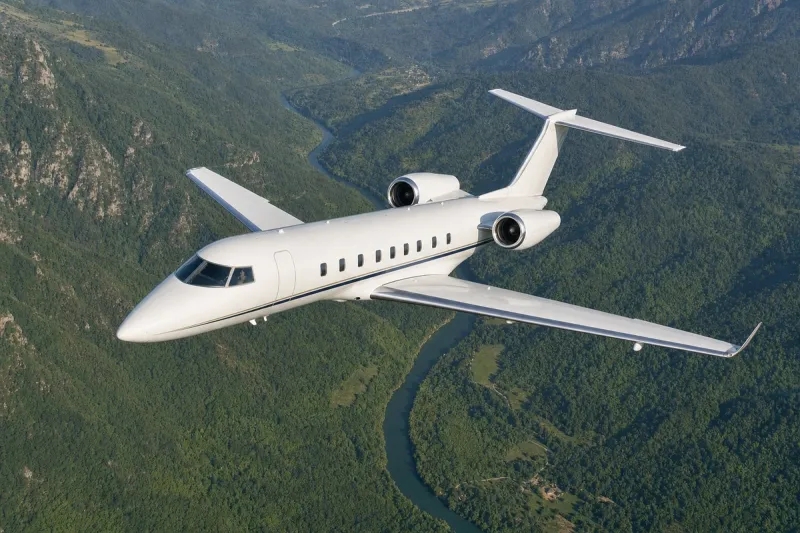
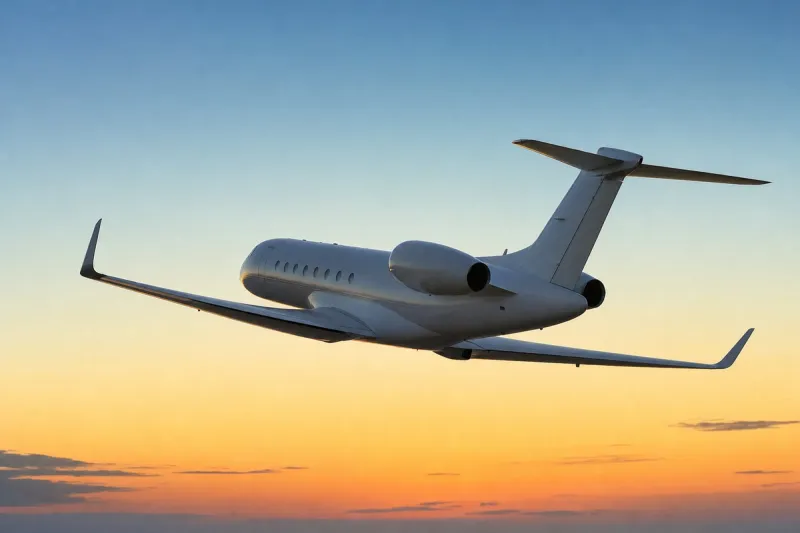
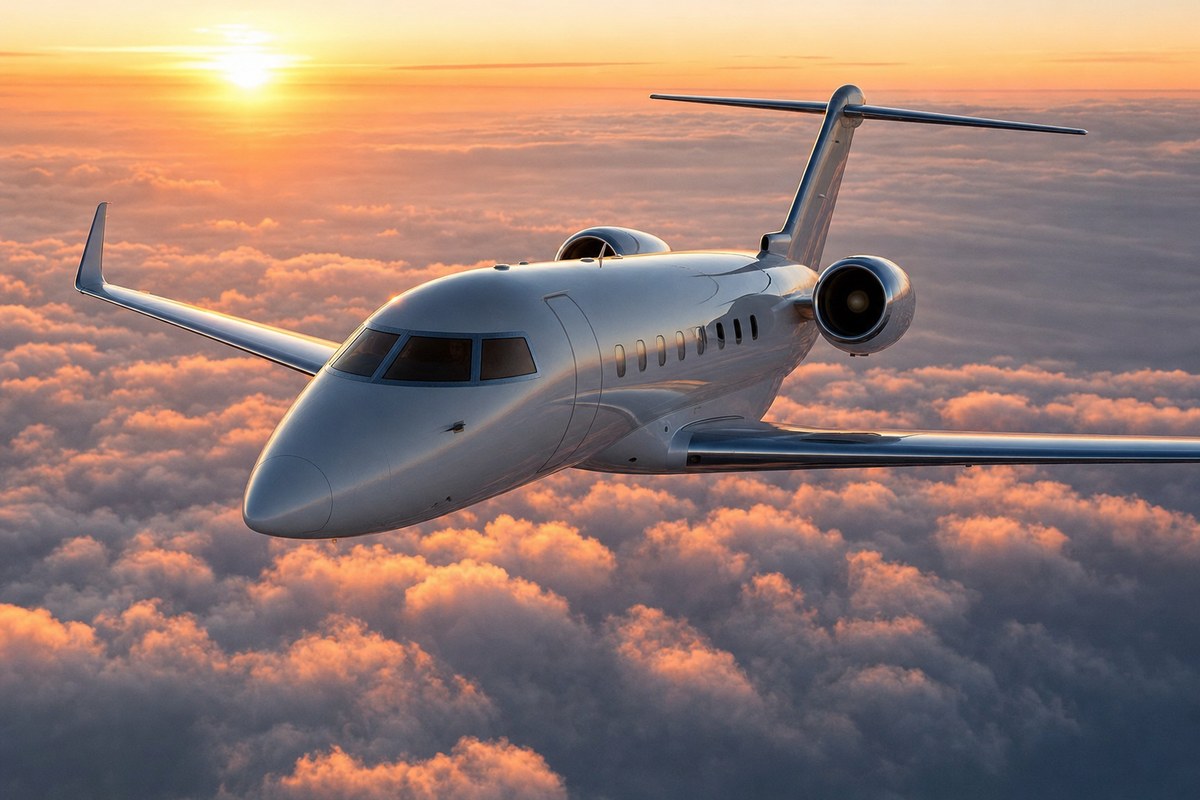
Great-circle distances from Dubai run from 4,874 nm to Perth and 5,938 nm to Adelaide, through 6,283 nm to Melbourne, 6,467 nm to Brisbane and 6,500 nm to Sydney, to 7,668 nm to Auckland. Large-cabin jets such as the Falcon 900LX, Falcon 2000LXS, Challenger 650, G400 and G500 do not clear these distances.
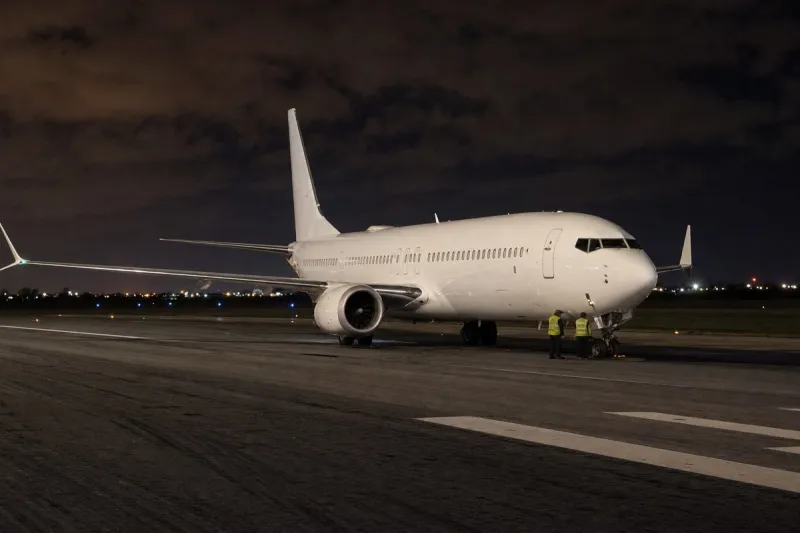
The BBJ MAX 7 (6,810 nm) reaches every Australian corridor but not Auckland, and the ACJTwoTwenty (5,724 nm) reaches only Perth. On the BCA basis the G700 (7,765 nm) leaves 97 nm of margin to Auckland; on AMSTAT figures the Global 7500 (7,700 nm) leaves 32 nm.
Range per dollar
The Global 6500 (US$61.0 million, 6,636 nm) delivers 109 nm per million dollars and suits missions without Auckland, with 136 nm of margin to Sydney. With Auckland in the mission set, the G800 (US$80.4 million, 8,220 nm) scores 102 nm per million dollars and is the only in-production aircraft with more than 500 nm of margin to Auckland (552 nm).
The Global 8000 offers 374 nm of margin at US$85.0 million. The BBJ MAX 7 (US$97.5 million) and ACJTwoTwenty (US$82.5 million) each deliver about 70 nm per million dollars, roughly 36% less than the Global 6500.
Industry impact & what to watch
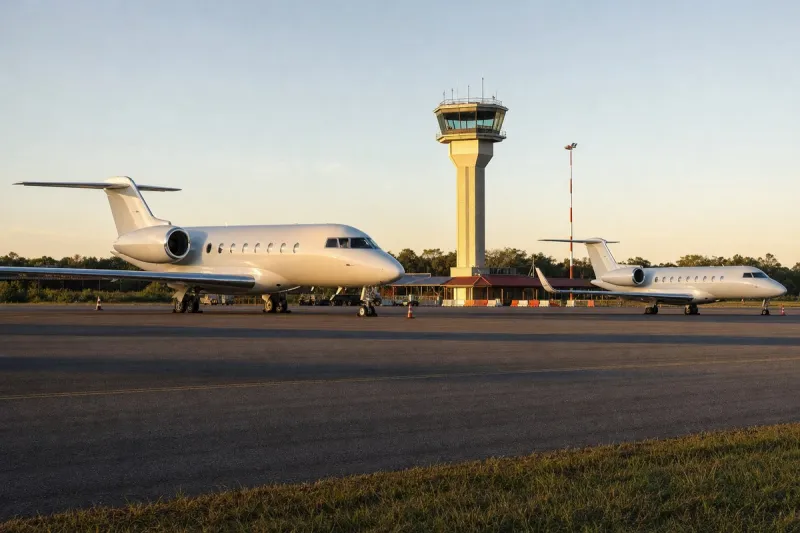
Scheduled premium seat counts capture only part of high-value travel. The analysis cites Dubai-Geneva, where scheduled premium seats grew only 2.6% a year because high-value demand moves largely by private aviation. A flat line on Dubai-Auckland can therefore sit alongside real demand that never shows up in airline seat data.
For New Zealand, the analysis points to the Active Investor Plus visa. From 1 April 2025 it replaced a weighted NZ$15 million threshold with a Growth category at NZ$5 million over three years and a Balanced category at NZ$10 million over five, and by mid-2026 it had drawn about NZ$4.5 billion in committed investment. Dubai-Auckland also showed the smallest 2026 decline of any Dubai corridor.
The analysis advises holding capital posture until Q4 load-factor and frequency data arrive. Until then, the September to December schedule remains provisional, so the full-year 2026 picture is still open.