Powerplant Failures Led Fatal Business Aviation Accidents in Q2 2026, NBAA Analysis Finds
Why It MattersQuarterly safety analyses that track near-misses alongside accidents give operators a broader signal on where maintenance and procedural attention is most needed before failures turn fatal.
What happened
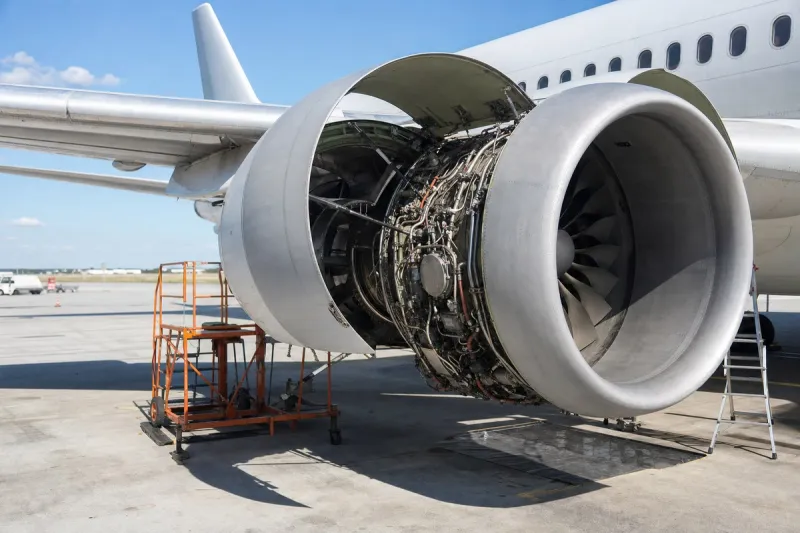
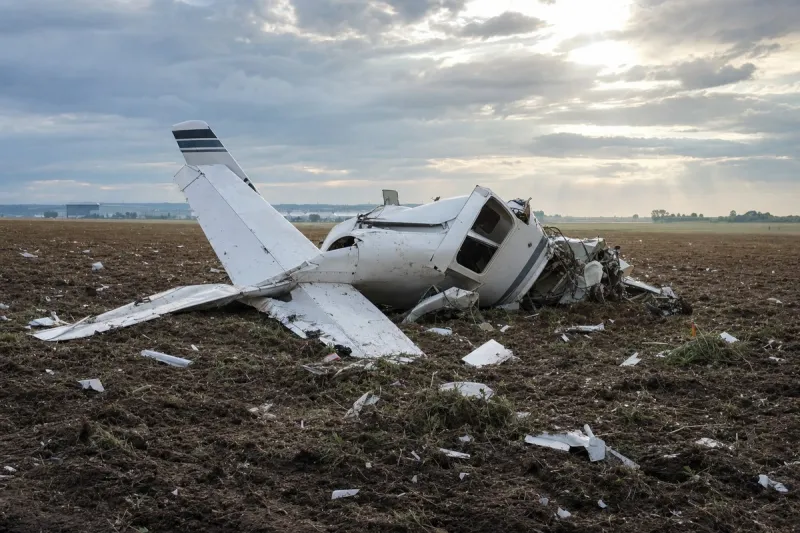
The National Business Aviation Association's Q2 2026 analysis, covering April through June, found that powerplant system and component failures were the leading cause of fatal business aviation accidents during the quarter. The report examined 66 total events, split between 42 incidents and 24 accidents. Six of the accidents were fatal, resulting in 22 fatalities, and the fatal accidents involved two business jets, three business turboprops, and one turbine helicopter.
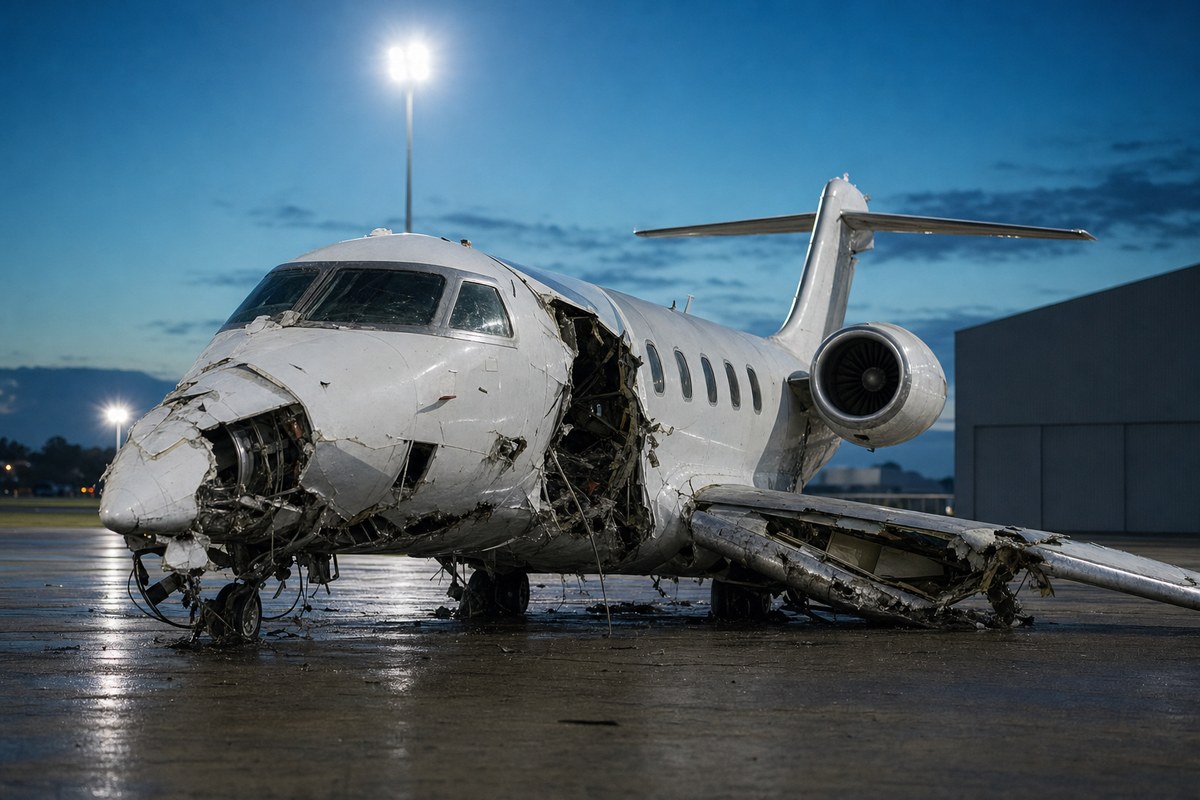
Collisions during takeoff or landing were the most frequent accident type overall, with one fatal and four non-fatal occurrences. Runway excursions and powerplant system or component failures each accounted for three accidents. Across all 66 events, bird strikes were the most common occurrence at 12 cases, followed by non-powerplant system or component failures with 11 events, and powerplant system or component failures with nine.
Mark Larsen, NBAA's director of safety and flight operations, said the quarterly findings give the business aviation community "a clear and timely understanding of where risks are appearing across the operating environment." He added that the Q2 results reinforce the need for rigorous preflight preparation, disciplined takeoff and landing practices, runway-excursion prevention, and close attention to aircraft system and powerplant reliability. NBAA launched the quarterly Business Aviation Accident and Incident Analysis in the fourth quarter of 2025 to provide a consistent picture of safety events involving turbine-powered business aircraft.
Industry impact & what to watch
The Q2 data illustrates how safety patterns in turbine business aviation can shift quarter to quarter: powerplant issues drove the fatal outcomes even though collisions during takeoff and landing were the more frequent accident type overall. That distinction between frequency and severity is why NBAA tracks both accidents and non-accident incidents rather than accidents alone — a high count of bird strikes or system anomalies that never become accidents still points to where crews and maintenance teams are absorbing risk before it escalates.
NBAA has been explicit that the analysis identifies trends rather than assigns probable cause, which means operators and maintenance organizations are left to translate the pattern into their own inspection and training priorities rather than a single mandated fix. With only three quarters of data published since the series began in Q4 2025, whether powerplant failures recur as a leading factor or this quarter proves an outlier will depend on how the Q3 2026 analysis compares.